Posts

Showing posts from May, 2017

Puzzle with Precedents. What is the hidden word?

Tracing precedents and dependents need not be all hard work. They can be used to create some puzzles. A word is hidden in this spreadsheet. It has something to do with UK's election. (This spreadsheet has no macros.) Precedent Hidden Word

I want to trace precedents in Google Sheets

I want to trace precedents in Google Sheets. It is not possible to do that in Google Sheets. The closest way is to open the file with Excel or LibreOffice Calc. But there are compatibility problems with special formulas and macros. (Update: Please see the comments for this post)

Experts know the importance of "formula auditing"

In a survey, it was found that spreadsheet users who are every experienced or experts use "formula auditing tools" frequently, on average. With the measuring scale of "never use, rare use, occasional use, frequent use and daily use", an average of frequent use means that many use formula auditing tools daily. Furthermore, 51% of them use formula auditing tools to evaluate their spreadsheet models. In contrast, less than 10% of the less experienced spreadsheet users use formula auditing tools to evaluate spreadsheet models. A major component of "formula auditing tools" is for tracing precedents and dependents. Data are from this paper: Baker, Kenneth R., et al. "Comparison of characteristics and practices amongst spreadsheet users with different levels of experience."  arXiv preprint arXiv:0803.0168  (2008).

Influence Charts are important for every spreadsheet user

Image
An influence chart, in simple terms, is a map of all the elements and their connections in the model. In the spreadsheet context, an influence chart is a diagram of all the values, formulas and their connections in the spreadsheet. An influence chart is very important for spreadsheet design, understanding and error detection. An influence chart is as important as a Google map when you are exploring a new city. Without a map, you see only whatever is near to you. With a map, you get an overview of the city, and you can decide where you want to go. Just like a good map provides an overview of the city and the details, an influence chart provides an overview of the spreadsheet as well as the details. This Youtube video provides a good explanation of influence charts (also called influence diagrams): Influence Diagrams / Influence Charts

I want to save the precedent arrows.

If you are working on a spreadsheet, you may want to save the precedent arrows to your xls file. When you rework on your file, you can continue where you were before. Excel does not allow that. In contrast, LibreOffice Calc allows this. One up for Calc. In Excel, we can do that with the Excel extension  VisualCheck for Excel (  Influence charts: How to easily gain a powerful overview of your Excel spreadsheet model ). Some buttons in VisualCheck draw a different version of precedent arrows and these can be saved to a file.

Why don't companies report with real spreadsheets?

Almost all companies provide financial reports with tables of values. They don't really report with a spreadsheet, i.e., one with all the formulas, Samples of financial reports in "Excel" without any formulas: http://www.citigroup.com/citi/investor/qer.htm First quarter, 2017, "Excel" report: http://www.citigroup.com/citi/investor/data/qer117s.xls?ieNocache=454 It is so much harder to read a table of values. If you wonder whether a value is a summation of other values, you will have a hard time confirming that. If a formula is there, you just need to click on that cell to get your answer. With real spreadsheets, we can trace precedents and trace dependents to understand the spreadsheets much more easier. So why are most companies not reporting with real spreadsheets with all the original formulas?

Who is the odd woman out? (Part 2)

Image
Given a column of "similar" cells, how do we check whether the cells are used "consistently" by other cells? Any inconsistency could be a sign of error, or inconsistent design. The only quick method to check this is by the use of "Trace Dependents", or even better with "Multi-Dependents". (The slow and not so visually effective method is to use the "Find" function. Find "A1", find "A2", and so on,) For example, in this diagram, the column of cells (A1:A6) are used consistently. The dependent arrows from these cells are "consistent". In the next diagram, the arrows show many irregular patterns, indicating that the cells A1:A6 are not used consistently. To get these diagrams, 1) With "Trace Dependents". Select cell A1. Click on "Trace Dependents" under Formula Auditing. Repeat for cells A2 to A6. Alternatively, 2) With Multi-Dependents. Select A1:A6, click on "Mult

Who is the odd woman out?

In the previous posts about "odd man out", the focus is on a cell with a formula that is inconsistent with the neighboring cells' formulas. That is, the cell uses other cells (in its formula) differently from its neighboring cells. In this post about "odd woman out", the focus is on a cell that is used differently from its neighbors. For example, for a column of cells (A1:A10), A1 appears in C1's formula, A2 appears in C2's formula. and so on until A10 appears in C10's formula, except for A4 which does not appear in C4's formula. A4 is the odd one out. The terms "odd man out" and "odd woman out" have no gender meaning. They are used simply to differentiate the oddness. How can we use Excel to identify the "odd woman out"?

Who is the odd man out? (LibreOffice Calc)

In the previous posts, we see how we can use Excel to identify a cell with an inconsistent formula compared to its neighbors. The aim is to identify potential errors, or inconsistent designs. For LibreOffice Calc users, similar methods are available, as listed in the following table. Method Excel LibreOffice Calc Show Formula Yes Yes Show R1C1 Formula Yes (Check Options) Yes (Check Options) Formula Error Flag Yes (Check Options) - Row / Column Differences Yes (Find and Select / Go To Special) - (There is a similar function, but it needs a macro program.) Precedent Arrows    Single-cell Precedents Yes (Formula Auditing / Trace Precedents) Yes (Detective / Trace Precedents)    Multiple-cell Precedents Need a macro (e.g. VisualCheck or Power Formula Auditing ) Need a macro (e.g., VisualCheck  for LibreOffice or Power Detective ) Lib

Who is the odd man out? (Part 3)

Image
Part 3 on identifying the odd man out is about precedents. To recap, the aim in finding an inconsistent cell is that the inconsistency may indicate an error, or an inconsistent design. If the cells in a block have "consistent" formulas, then each cell will have a set of "consistent" precedent arrows. This is illustrated in the following diagram. Consistent Precedent Arrows among Cells If a cell has an "inconsistent" formula, its precedent arrows will be different. This is illustrated in the following diagram, using the same example as in part 2. Inconsistent Precedent Arrows. In Excel, getting the precedent arrows for a block of cells can be quite tedious. We need to click on a cell, click "trace precedents" (perhaps a few times), and repeat for each cell in the block. However, the process can be done easily with some VBA processing. The Multi-Precedent macro allows precedent arrows to be drawn for a selected block of cells. Th

Who is the odd man out? (Part 2)

Image
To recap, the aim in finding an inconsistent cell is that the inconsistency may indicate an error, or an inconsistent design. Excel provides a convenient way to identify a cell that is inconsistent with its neighbors. It puts a green triangle at the upper left corner. This is shown in the following diagram. There are two disadvantages. 1. Inconsistent cells at the end of a column or row are not highlighted. 2. The green triangle (or error flag) is also used to indicate other types of errors. The different errors are listed in Home/Options/Formulas/Error Checking Rules. There is another to identify inconsistent cells. This is done by first selecting the "consistent" block of cells (C1:C6 in this case), then select Home /Find and Select / Go To Special / Column Differences. The result is as shown. "Column Differences" Note that two cells are highlighted (C4 and C6). This method may be harder to use if the block of cells stretches over a screen

Who is the odd man out?

Image
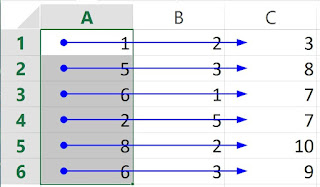
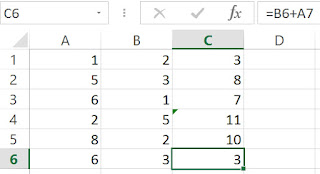
In Excel, very often, we expect a block of cells to have "consistent" formulas. For example, if cell C1 is "=A1+B1", and cell C3 is "=A3+B3", then we expect cell C2 is "=A2+B2". Sometimes, a cell may have an inconsistent formula. This could mean an error, or an inconsistent design, or a special case, and could warrant more attention. So, how do we find the odd man out? There are many ways to do this in Excel. First we explore the textual methods, by looking at formulas. Normal Formulas We can also show formulas with the R1C1 format (Choose File/Options/Formulas/R1C1 reference style). R1C1 Formulas To look for an inconsistent cell within a block of cells, the R1C1 format is easier for us to notice the difference, usually. In later posts, we will explore other more visual methods.

"Formula Auditing" is meant for every spreadsheet user, not just auditors.

Excel's "Formula Auditing" is meant for every spreadsheet user. As long as you need to understand a spreadsheet model, you will find "formula auditing" useful. (A spreadsheet model refers to the content inside the cells and their connections, e.g., a spreadsheet model may be a financial model about interest rates and returns.) "Few tools are available for understanding and debugging spreadsheets, but they are needed because spreadsheets are being used for large, important business applications. The key to understanding spreadsheets is to clarify the data dependencies among cells. [i.e., the precedents and dependents]. "  "There is greater potential benefit from auditing tools, which are intended to aid in understanding and debugging a completed spreadsheet."   "Teachers of spreadsheets should consider devoting a portion of the course to spreadsheet auditing techniques and tools, and should emphasize arrow-type tools."

How can I change precedent and dependent arrow colors? (LibreOffice)

Image
In LibreOffice Calc, we can choose the color for the precedent / dependent arrows. In LibreOffice (v5.3), choose    Tools/Options/LibreOffice/Application Colors You can select the color for "Detective" colors. "Detective" is the equivalent to Excel's precedent and dependent tracing. Color for Detective Arrows (Precedents and Dependents) Note that  LibreOffice changes all Detective arrows, including those that are already drawn, to the new color.  It is not possible to get two colors for the arrows in the same screen. However, with Basic programming in LibreOffice, it is possible to trace with different colors in the same sheet (worksheet). This is shown in the following diagram, with the software extension described in this book: Easily understand your spreadsheet model and detect errors with influence charts (For LibreOffice Calc) LibreOffice. Different Precedent Arrow Colors

Is it possible to change the colors of the precedent and dependent arrows?

Image
"Is it possible to format the trace precedents and dependents arrows? I want to change colours of the arrows." In Excel, the answer is no. For LibreOffice Calc, the answer is yes. (See a later post on this) But, in Excel, you can do some programming in VBA to do your own precedent and dependent tracing with the colors of your choice. For example, this diagram with different arrow colors was made with VBA macros. Each color indicates a group of cells that are connected.  The diagram shows 3 colors, indicating 3 groups of cells that are not connected to one another. Precedent Arrows with Different Colors This is done with the VisualCheck software described in this book: Influence charts: How to easily gain a powerful overview of your Excel spreadsheet model

LibreOffice Calc Users have Powerful Precedent Tracing Tools

LibreOffice Calc has a Detective menu to trace precedents and dependents. Similar to Excel's formula auditing tools, the tracings are limited to one cell at a time, and each click goes one level further. This new book,  Easily understand your spreadsheet model and detect errors with influence charts (For LibreOffice Calc), improves the detective tracing ability with LibreOffice Basic programming. Calc users can now trace precedents and dependents over many cells, or many levels at once. There are more functions described in the book. This unique spreadsheet book shows you how you can quickly and easily gain an overview of your spreadsheet model, with just a few clicks. The automatically generated overview, with the specialized software (VisualCheck, tested with LibreOffice 5.3) that comes with the book, allows easy understanding and error detection, as illustrated in the book. This book is meant for all types of spreadsheet users. It is meant for both novice and exp

Animated Trace Precedents over many Cells

Image
"Trace Precedents", a function in Excel, can be used to trace precedents of one cell, one level further up the precedent "tree" or chain with each click. Multi-Precedent is a specially developed macro that allows us to trace precedents of many cells together. The following picture shows multi-precedent at work, tracing precedents for two cells together. It also shows "Less-Multi-Precedent" at work. This multi-precedent macro is described in this book+software:   Influence charts: How to easily gain a powerful overview of your Excel spreadsheet model .

Doing Magic with Trace Precedents

Image
Trace precedent is a basic function. It draws an arrow from one cell to another cell when the first cell appears in the second cell's formula. That means the second cell makes use of the first cell's value. When enhanced with VBA progamming, trace precedent can do some interesting stuff. For example. it can trace everything in a worksheet and give a different color to separate groups. A sample result is in the following diagram. This colorful set of precedents and groups can be easily done by users of any level. The details are in this book:   Influence charts: How to easily gain a powerful overview of your Excel spreadsheet model

Book: Influence charts: How to easily gain a powerful overview of your Excel spreadsheet model

Influence charts: How to easily gain a powerful overview of your Excel spreadsheet model   Books about Excel don’t tell you how to gain an overview of the model in a spreadsheet. They talk about how to cut and paste, how to write formulas, and how to use special formulas. But do you know how all these formulas are organized in a spreadsheet model? Normally, people will have a very hard time doing this, as they have to look at formulas one at a time.  This unique Excel book shows you how you can quickly and easily gain an overview of an Excel model, with just a few clicks. The automatically generated overview, from the specialized software (VisualCheck) that comes with the book, has many powerful uses, as illustrated in the book. This book is meant for all types of Excel users. It is meant for both novice and expert users. Whether you create spreadsheets or you work with other people’s spreadsheets, this book will be very useful for you. This book